Keywordscost to income efficiency ratio financial intermediation financial performance liquidity risk multiple linear regression risk profile
JEL Classification G32
Acknowledgment:
This paper was part of the 24nd International Economic Conference of Sibiu, Romania 2017 – IECS 2017.
Full Article
1. Introduction
In the post-crisis period, the performance of commercial banks declined significantly against the background of the risks assumed during the economic boom. To mitigate the adverse effects of banks, bank merger phenomena have intensified and significant amounts of money have been injected in the form of capital inputs. In the context of these events, in conjunction with the high degree of concentration of the Romanian banking system, the systemic risk increased significantly.
Maximizing profit, while reducing the assumed risk is the main objective of banking activity. The study aimed at identifying the performance-risk relationship at the level of the commercial banks listed on the Bucharest Stock Exchange. At the end of 2015, the four banks had a market share of 47.18%, which is why we appreciate the results obtained as relevant.
2. Literature Review
Increasing the efficiency of a commercial bank’s activity is one of the objectives of banking management. Cost-effective management contributes directly to improving the performance of a commercial bank. Therefore, in many studies it has been shown that a commercial bank is profitable when the value of the „cost to income” ratio is low. Given that revenue is generated without auxiliary costs, banks are making considerable efforts to adjust their spending to business volume. (Bourke, 1989; Molyneaux and Thornton, 1992; Vennet, 2002; Athanassoglou et al, 2006; Bodla and Verma, 2006).
Essentially, the efficiency of a commercial bank’s activity is also influenced by numerous factors. In the opinion of some researchers, the ratio between a bank’s capital and total assets influences its effectiveness (Ni?oi, 2016).
The efficiency of banking activity is influenced by many factors, including financial structure, bank size, credit growth and deposit growth (Andries, 2011). There is a proportionate relationship between the rate of credit growth and the risk assumed by a bank (Kwan and Eisenbeis, 1997). Starting from this premise, in 2012, Fahlenbrach, Prilmeier and Stulz demonstrated that banks with a high credit growth rate faced a low efficiency of their activity in times of crisis (Fahlenbrach et al., 2012).
The increase in the saving phenomenon tends to diminish the efficiency of banking activity by increasing the cost of passive interest. However, in the literature it has been shown that by diversifying deposits (depending on the geographical area, categories of creditors, etc.) and reducing their absorption ratio, banks can reduce their exposure to liquidity risk, and, on the other hand, they can improve their efficiency by reducing the weighted average cost of capital (Reza et al., 2016).
3. Data and Methodology
Through the study, we estimate the impact of credit, liquidity and solvency risk on the operational efficiency of commercial banks listed on the Bucharest Stock Exchange during 2010-2015. Credit risk was surveyed through the credit growth rate / depreciation adjustment ratio in total loans; liquidity risk from the perspective of the loan / deposit ratio and the solvency in terms of equity / total assets ratio.
The necessary data for the research taken from the financial statements of commercial banks listed on the Bucharest Stock Exchange, which had a 47.18% market share at the end of 2015, were econometrically modeled using the E-Views9 software, using the multiple linear regression. The “Efficiency ratio” indicator was considered a dependent variable, and the equity / total assets ratio, credit growth rate and loan / deposit ratio are the independent variables. The general formula of the multiple linear regression equation is ![]() , where m<5, adapted to the specificity of the study in question. The general form of the equation is also used in the study carried out by Popovici (2013). Therefore, the estimated regression equation is the following:
, where m<5, adapted to the specificity of the study in question. The general form of the equation is also used in the study carried out by Popovici (2013). Therefore, the estimated regression equation is the following:
![]()
where:
Ea – efficiency ratio (cost to income);
α – proportion of the variance contribution of Cap pr/TA, RCC, Cr/Depr to the variation of efficiency ratio indicator;
Cap pr/TAi – equity / total assets ratio;
RCC i – growth rate of credits;
Cr/Depi – loans / deposits ratio.
4. Results of the Research
Under the guidelines developed by the European Banking Authority at the end of 2015, it is considered that a commercial bank’s activity is effective when the amount of operational expenditure does not exceed 50% of the operating revenue. Exceeding this limit indicates an increase in bank risk.
The evolution of the “Cost to income” ratio at the level of commercial banks listed on the Bucharest Stock Exchange, 2010-2015 is presented in figure no. 1.
In the period 2010-2013, listed commercial banks (excluding Carpatica Commercial Bank SA) recorded an appropriate level of the indicator. Over the 2014-2015 period, the recommended level of the indicator was exceeded in three of the listed commercial banks, as a result of the increase in operational expenditure, with a significant decrease in operational revenues.
The high value of the indicator in 2014 for Banca Comerciala Româna SA is mainly due to the increase of the expenses with the adjustments regarding the depreciation of the financial assets and the decrease of the interest income. The increase in operating expenses at a higher rate compared to the increase in operating revenues was the main cause of the evolution of the “cost to income” ratio registered by Banca Transilvania in 2014 and 2015.
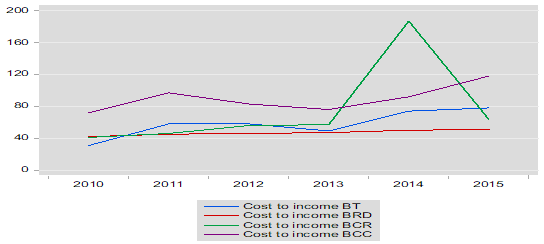
Figure 1. Comparative evolution of the „efficiency ratio” indicator in the listed commercial banks,
between 2010-2015 (%)
Source: authors’ processing
Following in the study, we present the impact that the risk profile of each of the listed banks is likely to impress on profitability.
4.1. Romanian Commercial Bank – Member of Erste Group
The synthesis of the results obtained by applying the regression model, meant to indicate the performance-risk interdependence, 2010-2015, is presented in table no. 1 and Diagram no. 1.
Table 1. The performance-risk regression statistics at the level of Romanian Commercial Bank SA
| Variable | Coefficient | Std. Error | t-Statistic | Prob. |
| C | 7.37 | 1.73 | 4.26 | 0.05 |
| CAPITAL_PR_TA | -0.33 | 0.11 | -2.95 | 0.10 |
| CREDITE_DEPOZITE | -0.04 | 0.02 | -2.60 | 0.12 |
| RITM_DE_CRESTERE_A_CREDI | -0.05 | 0.02 | -2.83 | 0.11 |
| R-squared | 0.9259 | Mean dependent var | 0.76 | |
| Adjusted R-squared | 0.8149 | S.D. dependent var | 0.55 | |
| S.E. of regression | 0.2383 | Akaike info criterion | 0.20 | |
| Sum squared resid | 0.1136 | Schwarz criterion | 0.07 | |
| Log likelihood | 3.39 | Hannan-Quinn criter. | -0.35 | |
| F-statistic | 8.34 | Durbin-Watson stat | 3.01 | |
| Prob(F-statistic) | 0.11 | |||
Source: authors’ processing
Since the determination coefficient does not differ significantly from the adjusted determination coefficient (Rsquare=0.9259; Adjusted R Square = 0.814), the normality hypothesis is validated, the resulting conclusion and the relation between the determination coefficient (R2 =0.92), the standard error (S?=0.23) and the calculated value of the F test (Snedcor = 8.34). The value of the Durbin-Watson statistical test (3.01 as compared to value 2 – the optimum recommended), indicates a strong negative correlation of residuals.
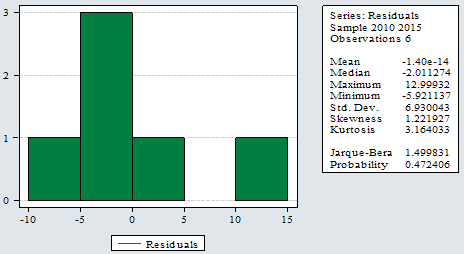
Diagram no. 1 shows the results of the tests performed on the residuals’ normality hypothesis.
In the analysis of the performance-risk interdependence at the level of the Romanian Commercial Bank there was a Platykurtic distribution (Kurtosis <3) and a positive asymmetry (Skewness> 0) of the residuals. The Jarque Bera test confirms the abnormal distribution of the dataset resulting in a probability of 0.68% to accept the residuals’ normal distribution hypothesis.
Diagram 1.Analysis of the results from the regression of the performance-risk interdependence at the level of the Romanian Commercial Bank SA, 2010-2015
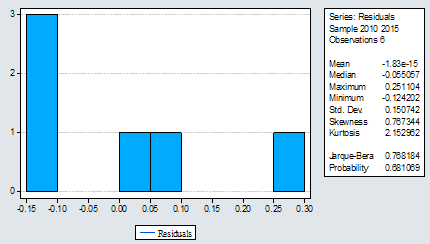
Source: authors’ processing
The resulting regression equation is:
![]()
As such, the regression model built indicates that the variation of the efficiency ratio coefficient is explained by the 92.59% variation of the endogenous factors variation (according to the results presented in Table 1). The estimated growth rate of the loan portfolio (-0.05) shows that a 1% increase in the loan portfolio has the effect of reducing the efficiency of the bank’s activity by 5%. The most important influence on the cost to income ratio at the bank level is held by the equity / total assets ratio, an increase of 1% on average resulting in a 33% decrease in profitability, while the addition of the same percentage of loans / deposits ratio is likely to generate a decrease of an average of 4% in the profitability coefficient.
4.2. Romanian Development Bank – Groupe Societe Generale
The synthesis of the results obtained by applying the regression model in the estimation of the performance-risk interdependence is presented in table no. 2.
Table 2. Performance-risk regression statistics at the level of Romanian Development Bank – Groupe Societe Generale
| Variable | Coefficient | Std. Error | t-Statistic | Prob. |
| C | 0.54 | 0.06 | 8.62 | 0.01 |
| CAPITAL_PR_TA | 0.009 | 0.004 | 2.12 | 0.17 |
| CREDITE_DEPOZITE | -0.002 | 0.0002 | -9.73 | 0.01 |
| RITM_CRESTERE_CREDITE | 0.0005 | 0.0005 | 0.97 | 0.43 |
| R-squared | 0.9875 | Mean dependent var | 0.47 | |
| Adjusted R-squared | 0.9688 | S.D. dependent var | 0.03 | |
| S.E. of regression | 0.005 | Akaike info criterion | -7.21 | |
| Sum squared resid | 6.8217 | Schwarz criterion | -7.35 | |
| Log likelihood | 25.64 | Hannan-Quinn criter. | -7.76 | |
| F-statistic | 52.92 | Durbin-Watson stat | 2.14 | |
| Prob(F-statistic) | 0.01860 | |||
Source: authors’ processing
Validation of the normality hypothesis results from the relationship between the determination coefficient and the adjusted determination coefficient (Rsquare = 0.9875, Adjusted R Square = 0.9688), as well as the relationship between the determination coefficient (R2 = 0.995), the standard error Sε = 0.005) and the value of F test (Snedcor = 52.962).
The results obtained from the statistical tests allow the elimination of the null hypothesis at the level of the equation as a whole (Prob (F-Statistic) 0.01% ? 0.05% - the significance threshold chosen). In contrast, at the level of the equation terms, the null hypothesis cannot be rejected in the case of the growth rate of loans (0.43 ÷ 0.05) and of the ratio of own capital / total assets (0.17>0.05).
The obtained Durbin-Watson statistical test (2.14 versus 2 - the recommended optimum) indicates a strong negative correlation of the residuals. Diagram no. 2 shows the results of the tests performed on the residuals’ normality hypothesis.
Diagram 2. Analysis of residuals resulting from the regression of the performance-risk interdependence in the case of the Romanian Development Bank – Groupe Societe Generale SA
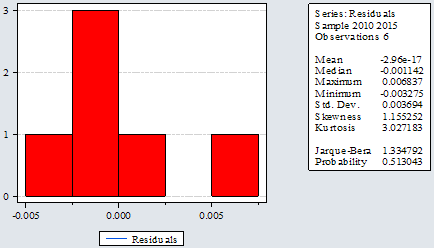
Source: authors’ processing
The result of the regression equation records a slightly Leptokurtic distribution (Kurtosis> 3) and a positive asymmetry (Skewness> 0) of residuals. The Jarque Bera test confirms the abnormal distribution of the data series, indicating a probability of 0.513% to accept the residuals’ normality distribution hypothesis.
The regression equation obtained is:
![]()
Therefore, the regression model indicates that the variation Ea is explained in a proportion of 98.75% by the endogenous factors’ modification (according to the results presented in table 2). The estimated credit portfolio growth rate of 0.0005 shows that a 1% increase in the loan portfolio may lead to an increase in the bank’s cost to income ratio of 0.05%. The most significant influence on the indicator is held by the equity / total assets ratio, which, by a 1% increase, results in an increase in profitability by 0.9%, while the increase by the same percentage of the loans / deposits ratio is likely to diminish the profitability coefficient by 0.02%.
4.3. Transylvania Bank SA
Between 2010 and 2015 Transylvania Bank recorded significant increases in the volume of credits granted, and implicitly increasing its operating income from interest. On the basis of the applied econometric models, it was found that at this bank, the growth rate indicator of credits is not an explanatory variable of the evolution of the “cost to income” coefficient. Thus, unlike the other two commercial banks presented, in the case of Transylvania Bank, the evolution of the “cost to income” coefficient is much better explained by the ratio between the credit depreciation adjustments and the total credits, as evidenced by the results of Table 3.
Table 3. Performance-risk regression statistics at Transylvania Bank SA
| Variable | Coefficient | Std. Error | t-Statistic | Prob. |
| C | 1.42 | 0.64 | 2.22 | 0.17 |
| CAPITAL_PR_TA | 0.09 | 0.03 | 3.44 | 0.08 |
| AJUSTARI_DEPRECIERE_TOTA | 0.03 | 0.01 | 2.16 | 0.16 |
| CREDITE_DEPOZITE | -0.03 | 0.01 | -2.78 | 0.11 |
| R-squared | 0.9261 | Mean dependent var | 0.58 | |
| Adjusted R-squared | 0.8152 | S.D. dependent var | 0.17 | |
| S.E. of regression | 0.0736 | Akaike info criterion | -2.15 | |
| Sum squared resid | 0.0108 | Schwarz criterion | -2.28 | |
| Log likelihood | 10.4366 | Hannan-Quinn criter. | -2.7 | |
| F-statistic | 8.3536 | Durbin-Watson stat | 3.19 | |
| Prob(F-statistic) | 0.1088 | |||
Since the determination coefficient (Rsquare = 0.926) does not differ significantly from the adjusted coefficient (Adjusted R Square = 0.8152), the normality hypothesis is validated. At the level of the equation as a whole, the results of the statistical tests do not allow the elimination of the null hypothesis (Prob F-Statistic 10.88% ? 5% significance threshold chosen). The null hypothesis can not be rejected for any regression term, since the values calculated for the T test are higher than the significance threshold chosen.
The value of the Durbin-Watson statistical test (3.19 vs. 2 - the optimal recommended) indicates a strong negative correlation of residuals. The results of the tests applied for the purpose of verifying the residuals’ normality hypothesis are shown in Diagram no. 3.
Diagram 3. Analysis of residuals resulting from the regression of the performance-risk interdependence at Transylvania Bank SA
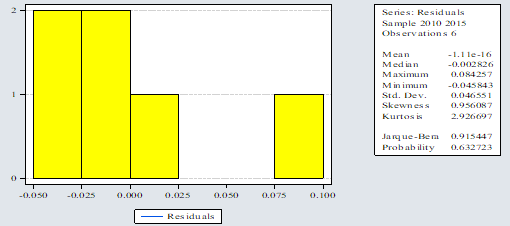
Source: authors’ processing
At Banca Transilvania SA, a Platykurtic distribution can be noticed (Kurtosis < 3) and a positive asymmetry (Skewness > 0) of residuals. The Jarque Bera Test confirms the abnormal distribution of the data series, resulting in a probability of 0.632% to accept the residuals’ normality distribution hypothesis.
The resulting regression equation is:
![]()
The change of the dependent variable “Cost to income” (Ea) is explained in a proportion of 92.61% by the change of the variables - the ratio of the equity / total assets, the loan portfolio performance ratio and the loans / deposits ratio (according to the results presented in Table 3) . The most significant influence on the “Cost to income” coefficient at this bank’s level is held by the equity / total assets ratio, which, by 1% increase, leads to an increase in profitability by 9%, while the same percentage increase in the loans / deposits ratio is likely to generate a 3% profitability decline.
4.4. Carpatica Commercial Bank
Unlike the other listed commercial banks, in the case of Carpatica Bank SA, the variation of the “Cost to income” ratio is not determined by the evolution of the three endogenous variables (table 4 and diagram 4).
Table 4. The performance-risk regression statistics recorded at Carpatica Commercial Bank SA
| Variable | Coefficient | Std. Error | t-Statistic | Prob. |
| C | 152.52 | 32.71 | 4.66 | 0.04 |
| CAPITAL_PR_TA | -4.86 | 4.03 | -1.21 | 0.35 |
| CREDITE_DEPOZITE | -0.54 | 0.90 | -0.60 | 0.61 |
| RITM_DE_CRESTERE_CREDITE | 0.51 | 0.60 | 0.83 | 0.49 |
| R-squared | 0.8291 | Mean dependent var | 89.67 | |
| Adjusted R-squared | 0.57 | S.D. dependent var | 16.77 | |
| S.E. of regression | 10.96 | Akaike info criterion | 7.86 | |
| Sum squared resid | 240.13 | Schwarz criterion | 7.72 | |
| Log likelihood | -19.58 | Hannan-Quinn criter. | 7.30 | |
| F-statistic | 3.23 | Durbin-Watson stat | 2.88 | |
| Prob(F-statistic) | 0.25 | |||
Diagram 4. Analysis of the residuals resulting from the regression of the performance-risk interdependence at Carpatica Commercial Bank SA
Source: authors’ processing
We appreciate that the regression equation obtained is not significant in its entirety:
![]()
The arguments based on which we consider that the model has a low capacity to explain the evolution of the efficiency coefficient of the operational activity of Carpatica Commercial Bank SA are as follows:
- The null hypothesis on the coefficients of the terms of the equation cannot be countered in the case of any of them;
- The value of the determination coefficient (0.829) differs significantly from the value of the adjusted determination coefficient (0.57), which denotes a difficult model to be validated;
- Error spreading is not constant, as it results from the residuals’ analysis.
Profitability of Carpatica Commercial Bank SA has been significantly depreciated in recent years, against the backdrop of the alarming increase in operating expenditure compared to operating income. However, the impact of the risk factors on the variation of the “cost to income” ratio is minimal, suggesting that for this bank, the depreciation of financial performance can be explained by other indicators.
5. Conclusions
Due to the increase of operational expenses in the context of limiting the activity, the efficiency of banks’ operational activity declined considerably over the period studied, which is why we consider their profitability to be a vulnerable point at the end of 2015 in maintaining financial stability.
The research has confirmed the existence of a dependency relationship between the “Cost to income” ratio of commercial banks and the credit, liquidity and capital risk. The only bank whose “Cost to income” ratio is not explained by the three risk factors considered is Carpatica Commercial Bank - where we consider that low profitability can be explained by other factors (such as managerial decisions, strategies, etc.) difficult to quantify.
The research conducted showed that during 2010-2015, the change in the “Cost to income” ratio was largely influenced by the equity / total assets ratio, and the supervisory authority’s decision to tighten the capital requirement looks more than beneficial, which may provide the premises for streamlining the operational activity of a commercial bank. The same conclusions were drawn from Virginia Terraza’s (2015) study in 2015, namely that the level of capitalization of a commercial bank influences its profitability.
A moderate influence on the change in the indicator was manifested by the evolution of the loans / deposits ratio.
References
- Andrieș, A.M., 2011. The determinants of bank efficiency and productivity growth in the central and eastern European banking systems. Eastern European Economics, 49 (6), pp. 38–59.
- Athanasoglou, P.P., Delis, M.D. and Staikouras, C.K., 2006. Determinants of Bank Profitability in the South Eastern European Region. Bank of Greece Working Paper 47, p.1-37.
- Balteș, N. and Rodean (Cozma) M.D, 2015. The influence of the endogenous and exogenous factors on credit institutions’ return on equity. Studia Universitatis “Vasile Goldis” Arad. Economics Series, Vol 25 Issue 1, pp 16-25.
- Bodla, B.S. and Verma, R., 2006. Determinants of Profitability of Banks in India: A Multivariate Analysis. Journal of Services Research, 6(2), p.75-89.
- Bourke, P., 1989. Concentration and other Determinants of Bank Profitability in Europe. North America and Australia. Journal of Banking and Finance, 13, p.65-79.
- Fahlenbrach, R., Prilmeier, R. and Stulz, R., 2012. This time is the same; using bank performance in 1998 to explain bank performance in the recent financial crisis. The Journal of Finance, 67, pp. 2139-2186.
- Grigorian, D. and Manole, V., 2002. Determinants of commercial bank performance in transition: An application of Data Envelopment Analysis. Working Paper 2850, The World Bank.
- Kwan, S. and Eisenbeis, R., 1997. Bank risk, capitalization and operating efficiency. Journal of Financial Services Research, 12, pp.117-131.
- Molyneux, P. and Thornton, J., 1992. Determinants of European Bank Profitability: A Note. Journal of Banking and Finance, 16, pp.1173-1178.
- Nițoi, M. and Spulbăr, C., 2016. The relationship between bank efficiency and risk and productivity patterns in the Romanian Banking System. Romanian Journal of Economic Forecasting, XIX (1) , pp 39-53.
- Popovici, A., 2013. Probabilități, Statistică și Econometrie asistate de programul Excel. Bucuresti: Ed. Niculescu.
- Reza, R., Banafsheh, F., Meisam, S. and Fatemeh, R., 2016. Study of the Relationship between Credit Diversification Strategy and Bank’s Credit Risk and Return: Evidence from Tehran Stock Exchange (TSE). Procedia Economics and Finance, 36, pp. 62–69.
- Rodean (Cozma), M.D. and Balteș N., 2015. Study regarding the influence of the endogenous and exogenous factors on credit institution’s return on assets. Revista Economie Teoretică și Aplicată, XXIII, No1/2016, Spring, pp 247-254.
- Terraza, V., 2015. The effect of bank size on risk ratios: Implications of banks’ performance. Procedia Economics and Finance, 30, pp. 903–909.
- Vennet, V. R., 2002. Cost and Profit Efficiency of Financial Conglomerates and Universal Banks in Europe. Journal of Money, Credit and Banking, 34(1), pp.254-282.
Article Rights and License
© 2017 The Authors. Published by Sprint Investify. ISSN 2359-7712. This article is licensed under a Creative Commons Attribution 4.0 International License.